Is Node.js single-threaded or multi-threaded?
I am sure most of us who have used Node.js have heard of this statement:
Node.js is single-threaded.
Is this statement correct? Well yes, partially.
Node.js uses an asynchronous event-driven architecture consisting of an event loop and a worker pool.
When we say that Node.js is single-threaded, we are actually referring to the event loop which is also known as the single main/event thread. This event loop handles the orchestration of new client connection and the corresponding response.
The worker pool, as the name suggests, consists of multiple threads forming a thread pool, used particularly for expensive tasks that are I/O-intensive and/or CPU-intensive so that the main thread doesn’t get blocked.
The short answer to the question is Node.js: it is both single and multi threaded depending on what functions are being executed.
Worker pool
The worker pool is implemented using libuv.
According to the “don’t block the event loop” guide, these are the Node.js APIs that uses the worker pool:
I/O-intensive tasks
- DNS (
dns.lookup(),dns.lookupService())- File system (all file system API except
fs.FSWatcher()and those that are explicitly synchronous)
CPU-intensive tasks
- Crypto (
crypto.pbkdf2(),crypto.scrypt(),crypto.randomBytes(),crypto.randomFill(),crypto.generateKeyPair())- Zlib (all except those are explicitly synchronous)
On top of these, it’s also possible for applications and modules that use a C++ add-on to submit tasks to the worker pool.
This means all other intensive tasks do not make use of the worker pool:
- very long running for-loop (e.g a really inefficient way of determining if a number is a prime number)
- synchronous version of APIs listed above (e.g
crypto.randomFillSync(),zlib.inflateSyncetc)
Waiter in a restaurant
Still confused? Let’s look at an analogy instead.
Imagine a waiter working in a small restaurant with 5 tables.
The worker’s responsibilities are:
- attending to requests from each of the tables and bringing food orders to the kitchen for preparation
- serving up prepared food in a timely manner (nobody likes cold food right?)
Supporting him are the kitchen staffs whose responsibilities are to prepare the food and clear the trash as quickly and correctly as possible.
In this case, the waiter is the event loop (main thread) and the kitchen staffs are the worker pool.
When the order for steak and cheese fries (computationally intensive task like crypto.randomFill()) comes in, the waiter accepts the request and passes the order to the kitchen for preparation. This frees up the waiter to handle other requests.
Then another table requests for a glass of water. Since this is a relatively non-intensive task, the waiter has no need (also not able) to offload the preparation to the kitchen and is able to get the water and respond to the request quickly.
Once the steak and cheese fries order is ready, the waiter can head back to retrieve it and fulfill the request, wasting no time in between orders.
Now the problem starts when someone decides to order a whiskey highball (computationally intensive synchronous task like crypto.randomFillSync()) that can only be fulfilled by the waiter.
At the same time, 2 other order requests comes in. Being blocked by the whiskey highball preparation, the waiter has no way to attend to the new requests.
In the best case, the customers wait patiently for their requests to be attended to. Worst case, they get impatient and leave (requests timing out).
I hope this gives you have a better understanding of how the event loop and worker pool work together.
Experiment
So we know the theory, but how does a Node.js application’s performance differ between using non-blocking crypto.randomFill() (using worker pool) and blocking crypto.randomFillSync() (non worker pool) APIs in practice?
Also, how does using the worker pool actually look like in practice?
Setup
Node application source code: https://github.com/jaanhio/is-nodejs-single-or-multithreaded
To prevent noisy neighbour effect from affecting the result of the experiment, I am running the node.js application on my spare raspberry pi 4 (4CPU, 4GB memory) running ubuntu 21.10 kernel version 5.13.0-1031-raspi.
ubuntu@ubuntu:~$ lscpu
Architecture:                    aarch64
CPU op-mode(s):                  32-bit, 64-bit
Byte Order:                      Little Endian
CPU(s):                          4
On-line CPU(s) list:             0-3
Thread(s) per core:              1
Core(s) per socket:              4
Socket(s):                       1
Vendor ID:                       ARM
Model:                           3
Model name:                      Cortex-A72
Stepping:                        r0p3
CPU max MHz:                     1500.0000
CPU min MHz:                     600.0000
BogoMIPS:                        108.00

ubuntu@ubuntu:~$ free -m
               total        used        free      shared  buff/cache   available
Mem:            3791         227        3453           2         110        3426
Swap:              0           0           0
Execution
Test cases:
Buffer size used: 2**20 = 1048576
- asynchronous function
curl -v http://192.168.1.248:8080?type=async&size=1048576
const cryptoFillAsync = (bufferSize) => {
    console.log('executing crypto fill async');

    const buf = Buffer.alloc(bufferSize);

    return new Promise((resolve, reject) => {
        randomFill(buf, (err, buf) => {
            if (err) {
                console.log('err filling async', err);
                reject(err);
            }
            console.log('Buffer filled');
            resolve();
        })
    })
}
- synchronous function
curl -v http://192.168.1.248:8080?type=sync&size=1048576
const cryptoFillSync = (bufferSize) => {
    console.log('executing crypto fill sync');
    const buf = Buffer.alloc(bufferSize);
    randomFillSync(buf)
    console.log('Buffer filled');
    return;
}
Scenarios:
- max 5 users increasing at a rate of 1 user/sec
- max 50 users increasing at a rate of 10 users/sec
- max 100 users increasing at a rate of 20 users/sec
- max 150 users increasing at a rate of 20 users/sec
- max 200 users increasing at a rate of 20 users/sec
I tested each of the scenarios for 2 mins and here are the results.
| 5 users. 1 user/s | 50 users. 10 users/s | 100 users. 20 users/s | 150 users. 20 users/s | 200 users. 20 users/s | |
|---|---|---|---|---|---|
| asynchronous | error rate: 0%, 50th percentile latency: 57ms, 99th percentile latency: 90ms | error rate: 0%, 50th percentile latency: 53ms, 99th percentile latency: 250ms | error rate: 0%, 50th percentile latency: 51ms, 99th percentile latency: 260ms | error rate: 0%, 50th percentile latency: 53ms, 99th percentile latency: 280ms | error rate: 0%, 50th percentile latency: 64ms, 99th percentile latency: 330ms |
| synchronous | error rate: 0%, 50th percentile latency: 57ms, 99th percentile latency: 200ms | error rate: 1%, 50th percentile latency: 76ms, 99th percentile latency: 320ms | error rate: 7%, 50th percentile latency: 670ms, 99th percentile latency: 2100ms | error rate: 12%, 50th percentile latency: 790ms, 99th percentile latency: 4500ms | error rate: 24%, 50th percentile latency: 2300ms, 99th percentile latency: 7300ms |
It’s apparent that the use of asynchronous non-blocking function call greatly outperformed the synchronous blocking function call in terms of both the error rate and response time.
Perhaps you might still be wondering what exactly does it mean by blocking.
We can see this clearly by increasing the buffer size (to increase the compute time and resources required) such that there’s enough time to make a second call before the first one completes.
For that, I picked a number that requires both functions to take approximately 5s to execute and ended up with 2**27 = 134217728.
Asynchronous
As you can see, all 3 consecutive calls were accepted and handled by the server. The expensive compute was offloaded to the worker pool threads, leaving the event loop available to handle other incoming requests.
Now compare this to the synchronous version.
Synchronous
Even though 3 consecutive calls were made, the server could only handle 1 request at a time, leaving the other requests waiting. This resulted in a way higher request latency.
Increase the request rate to the scenarios mentioned above and you can imagine requests being queued so far back that they timed out.
All about the extra threads
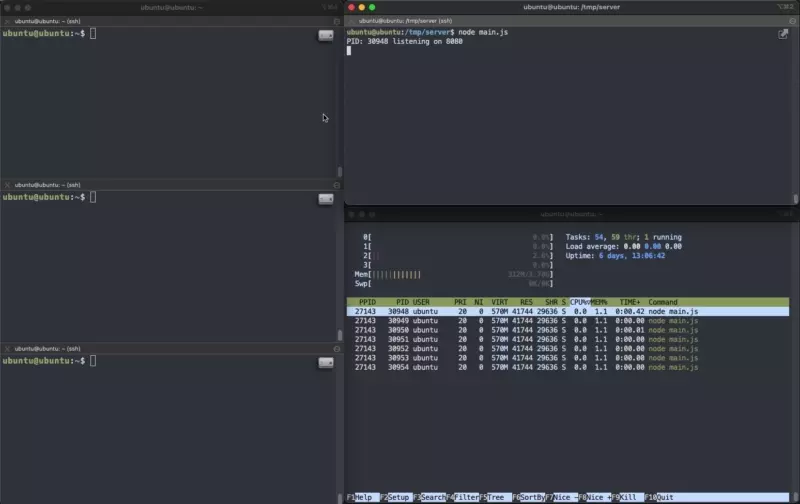
Those with sharp eyes might have spotted something: there’s more than 1 threads/processes that belongs to the application displayed by htop the moment I run it.
After enabling “Tree View” display setting on htop,
By now we know that Node.js has a single event loop thread and multiple worker pool threads that helps with CPU/I/O-intensive tasks.
Are those extra threads actually the worker pool threads?
From what I have gathered so far, these threads are actually by the V8 engine to perform tasks like garbage collection etc. They are different from the worker pool threads.
We can actually change the number of these threads using the --v8-pool-size option when running node.
Taken from https://nodejs.org/api/cli.html#--v8-pool-sizenum:
--v8-pool-size=num#Added in: v5.10.0
Set V8’s thread pool size which will be used to allocate background jobs.
If set to 0 then V8 will choose an appropriate size of the thread pool based on the number of online processors.
If the value provided is larger than V8’s maximum, then the largest value will be chosen.
Let’s try running it again with the --v8-pool-size option.
What about the worker pool threads?
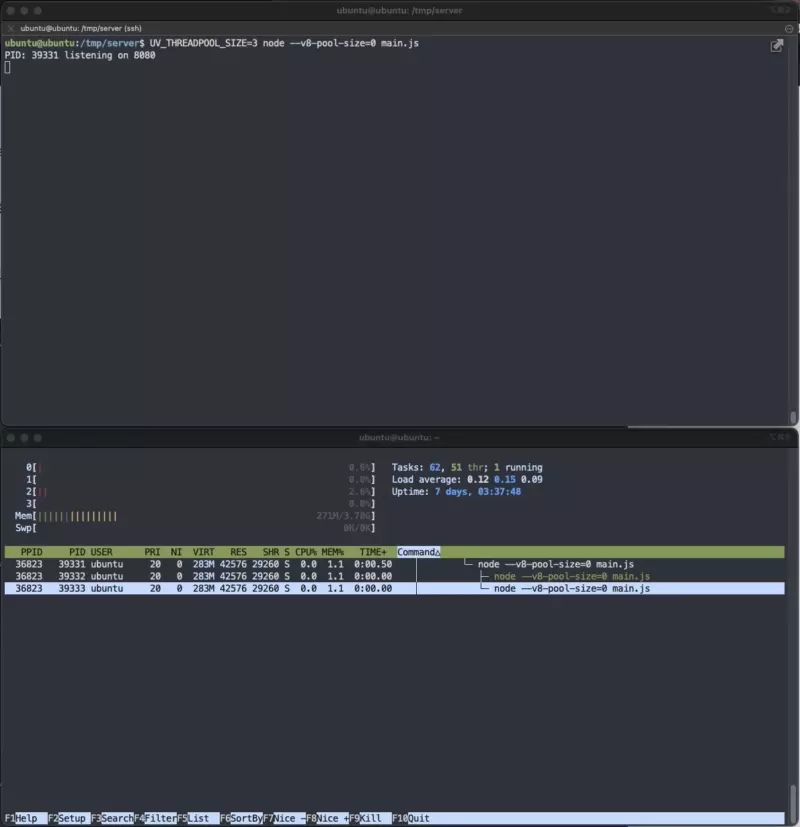
Turns out, we are also about to configure the number of threads in a worker pool using environment variable UV_THREADPOOL_SIZE.
UV_THREADPOOL_SIZE=3 node --v8-pool-size=0 main.js
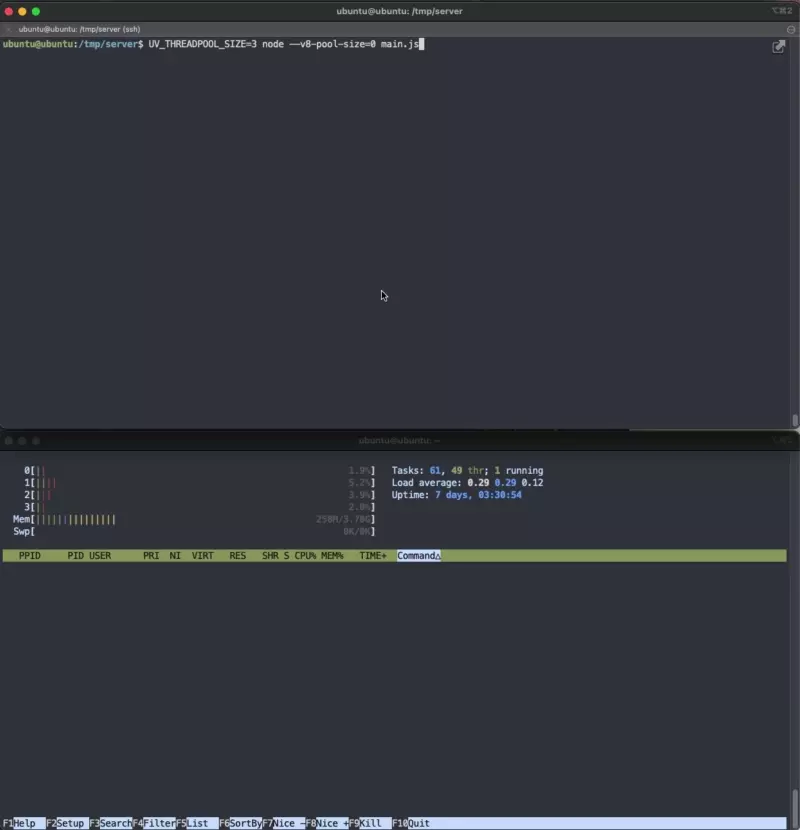
Wait, there’s no changes to the number of threads isn’t it? It’s still the same number of threads as above.
The magic happens when the server starts calling functions that are able to use the worker pool.
For that, I made a total of 9 requests at once to trigger the asynchronous function call.
time curl -v "http://localhost:8080?type=async&size=134217728"
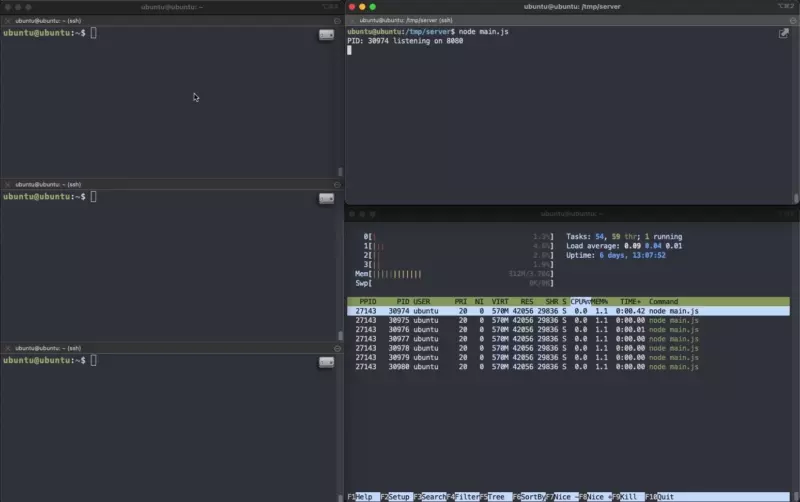
Notice that 3 other threads appeared (can identify them by the new PIDs 39362 - 39364).
Also notice that although all requests are “handled” by the server, the server could only process 3 of these CPU-intensive tasks at a time, resulting in request latency ranging from 4.9s - 14.8s.
Does this mean by increasing UV_THREADPOOL_SIZE=9 we should expect a way lower request latency?
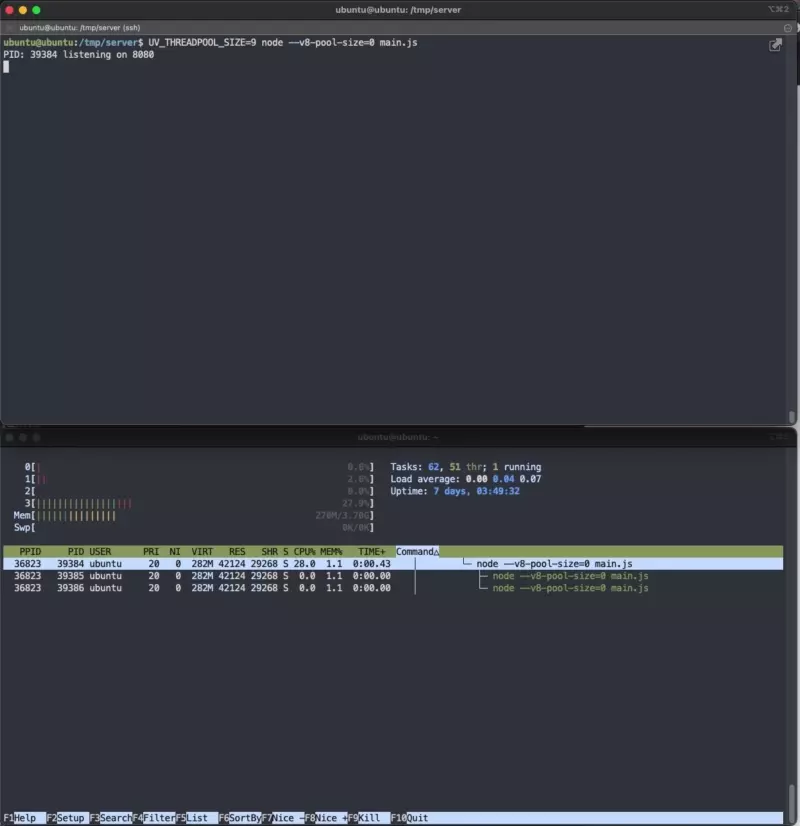
The request latency became more uniform (~11s), which also meant a much longer waiting time for 2/3 of the requests when comparing it to UV_THREADPOOL_SIZE=3.
I repeated the same for 3 other thread pool size. Note again that this is running on a 4CPU, 4GB memory raspberry pi4.
| min latency (s) | max latency (s) | avg latency of 9 requests (s) | |
|---|---|---|---|
| size = 2 | 4.928 | 24.362 | 13.548 |
| size = 3 | 4.912 | 14.667 | 9.794 |
| size = 4 | 4.926 | 14.728 | 8.248 |
| size = 5 | 5.546 | 11.321 | 8.343 |
| size = 6 | 6.180 | 12.115 | 8.884 |
| size = 9 | 10.976 | 11.145 | 11.069 |
What we can conclude:
- min latency is approximately 4.9s and starts increasing once thread pool size > 4
- lowest average latency is 8.248s when thread pool size = 4
Why is this so?
Context switching. It is the process that involves switching of tasks/processes running on the CPU to and from various states such as “ready”, “waiting”, “blocked”.
While the upside is giving CPU the ability to multitask, it comes with the cost of additional latency when switching between processes.
Some really useful reference materials:
- https://yarin.dev/nodejs-cpu-bound-tasks-worker-threads/
- https://nodejs.org/en/docs/guides/dont-block-the-event-loop/
- https://nodejs.org/api/cli.html#--v8-options
- https://stackoverflow.com/a/32507707/8096221
- https://github.com/nodejs/node/blob/278a9267ec41f37e6b7dda876c417945d7725973/src/node.cc#L3964-L3965
- OS Context Switching - Computerphile